Attendance and behaviour remain central to Ofsted’s view of a school’s effectiveness. Under the 2025 Education Inspection Framework, inspectors are clear that strong behaviour and high attendance are not just outcomes, but indicators of a well-led, inclusive school culture. In the SEF, leaders are expected to show how consistently behaviour expectations are applied, how pupils experience school day to day, and how effectively attendance is promoted and monitored.
Survey data can provide robust, credible evidence to support this evaluation.
What Ofsted is looking for in attendance and behaviour
Within the Behaviour and Attitudes judgement, Ofsted considers whether:
- Behaviour expectations are clear, consistently applied and understood by staff and pupils
- Pupils feel safe, calm and ready to learn
- Low-level disruption is rare and addressed effectively
- Attendance is high, with leaders understanding and responding to patterns of absence
- Pupils enjoy school and are motivated to attend
Inspectors are particularly interested in how leaders know this — and how evidence is used to inform action and improvement.
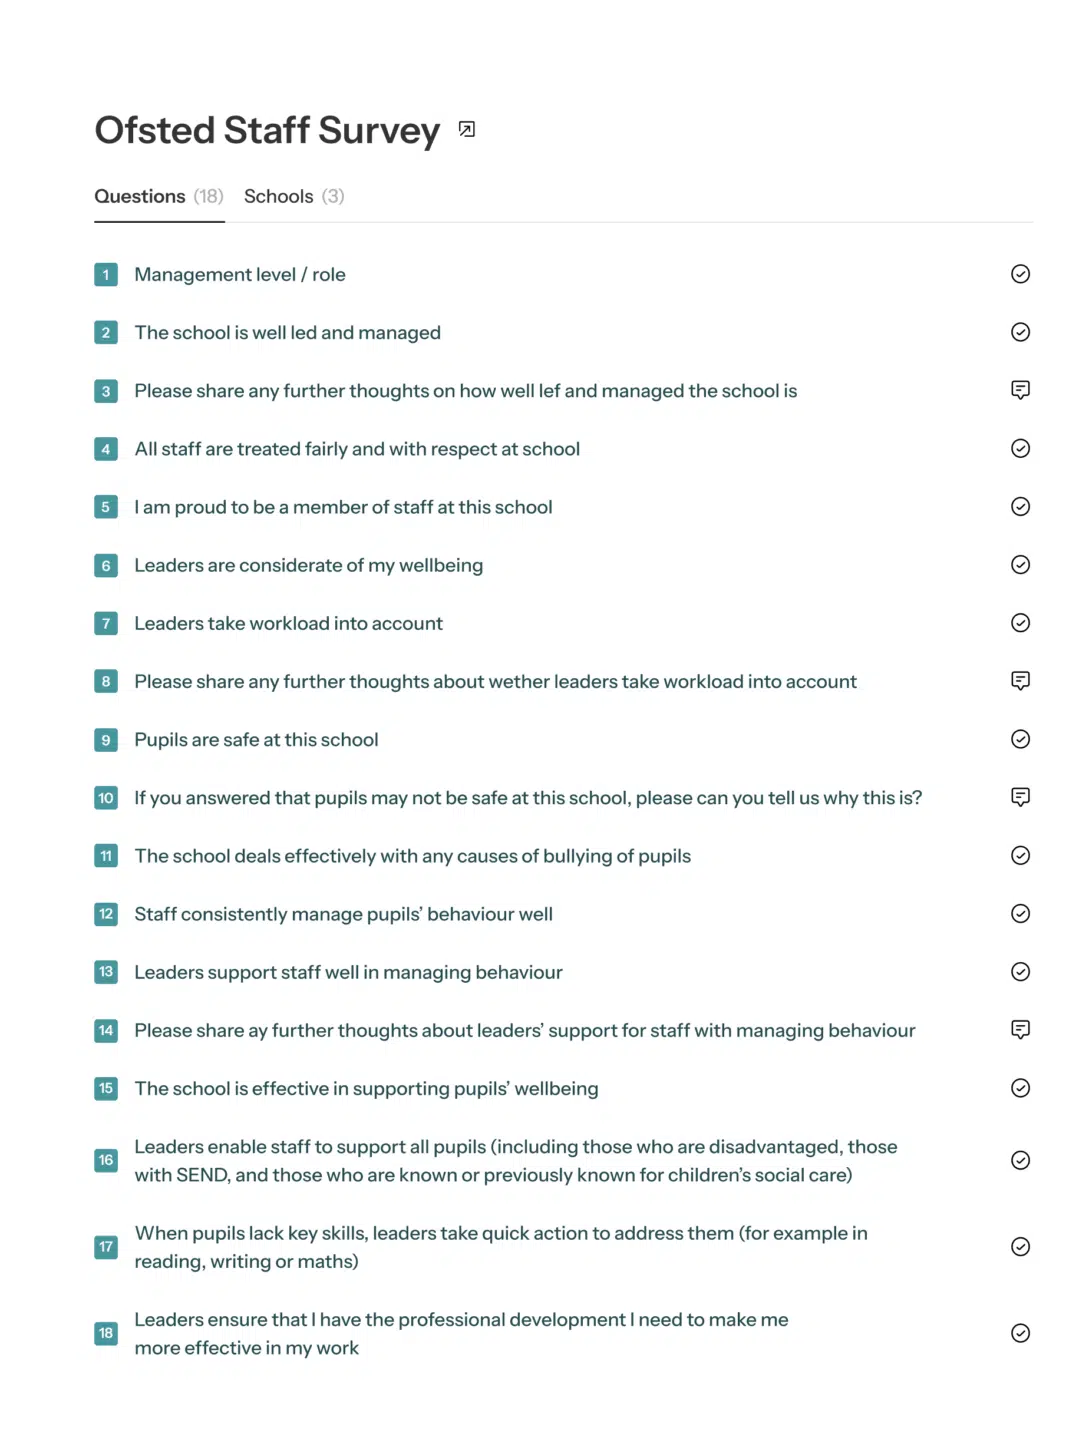
Using staff survey data to evidence consistency
Staff perspectives are invaluable when evaluating behaviour systems. Headline measures such as:
- the percentage of staff who believe leaders are doing enough to manage behaviour consistently
- the proportion who agree that the school’s behaviour policy is effective
can help leaders demonstrate whether expectations are embedded across the school and the consistency of their approach.
The Behaviour Barometer: auditing staff views
The Behaviour Barometer is our recommended template for surveying staff on this topic, covering the key metrics to build a picture of staff experiences of behaviour day to day around the school, and taking just a few minutes to run, ideally within a training session or briefing for maximum response rates.
These indicators are especially helpful in the SEF when discussing consistency — a recurring Ofsted theme. Strong results reinforce leadership impact; more mixed results allow leaders to show they have an accurate, reflective view of practice and are taking targeted steps to improve it.
Pulse surveys: tracking behaviour improvement in real time
Some schools go a step further by using short, regular pulse surveys to monitor very specific aspects of behaviour. For example, a fortnightly or monthly single-question survey asking staff to estimate lost minutes of teaching and learning can provide powerful insight:
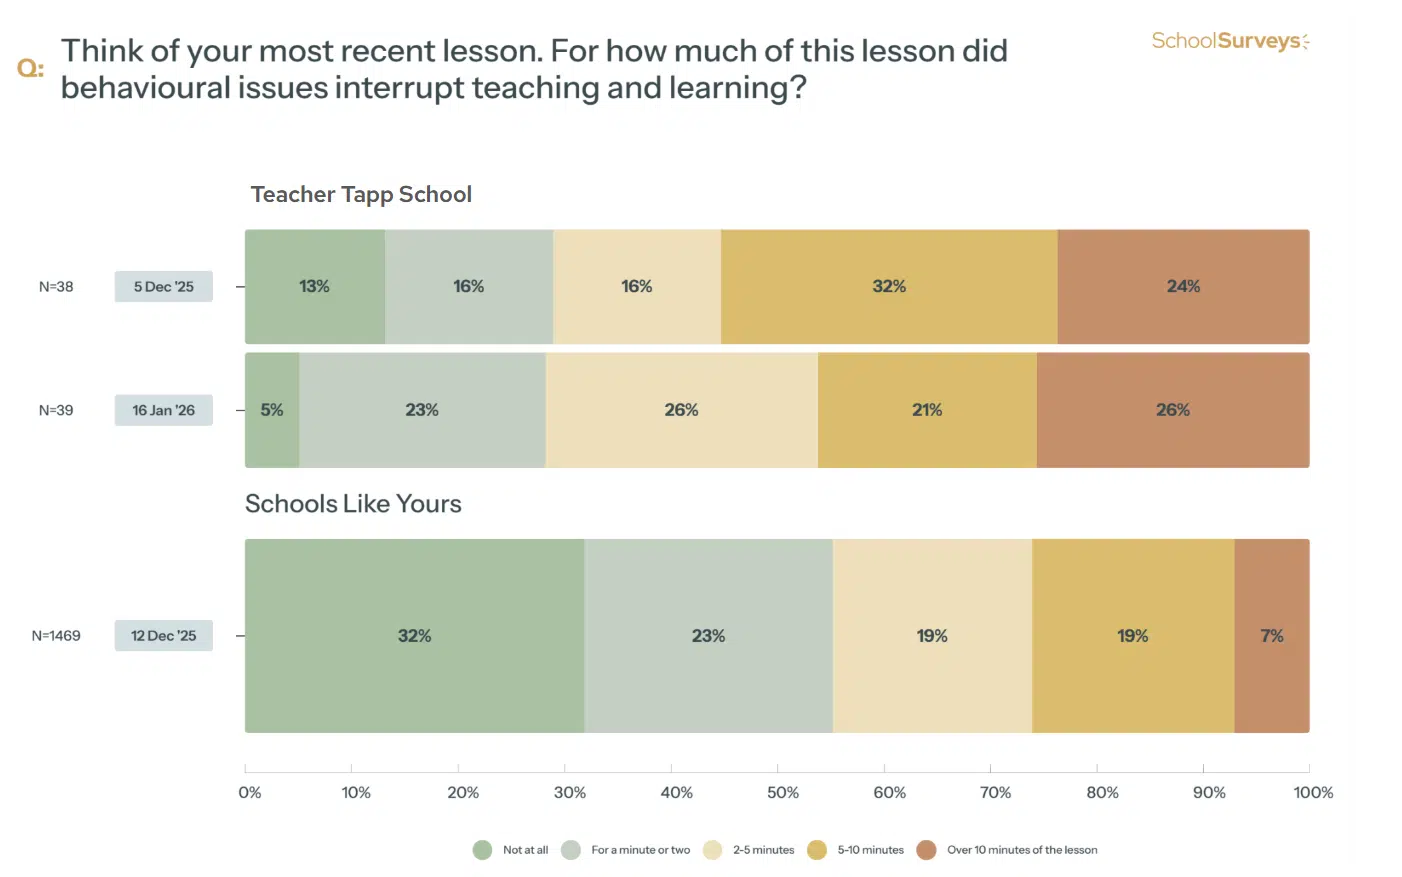
Over time, this type of data allows leaders to track whether behaviour strategies are reducing disruption and demonstrate measurable improvement. It also underlines the collaborative approach to school improvement, with leaders ensuring progress is charted and discussed regularly with the wider staff body.
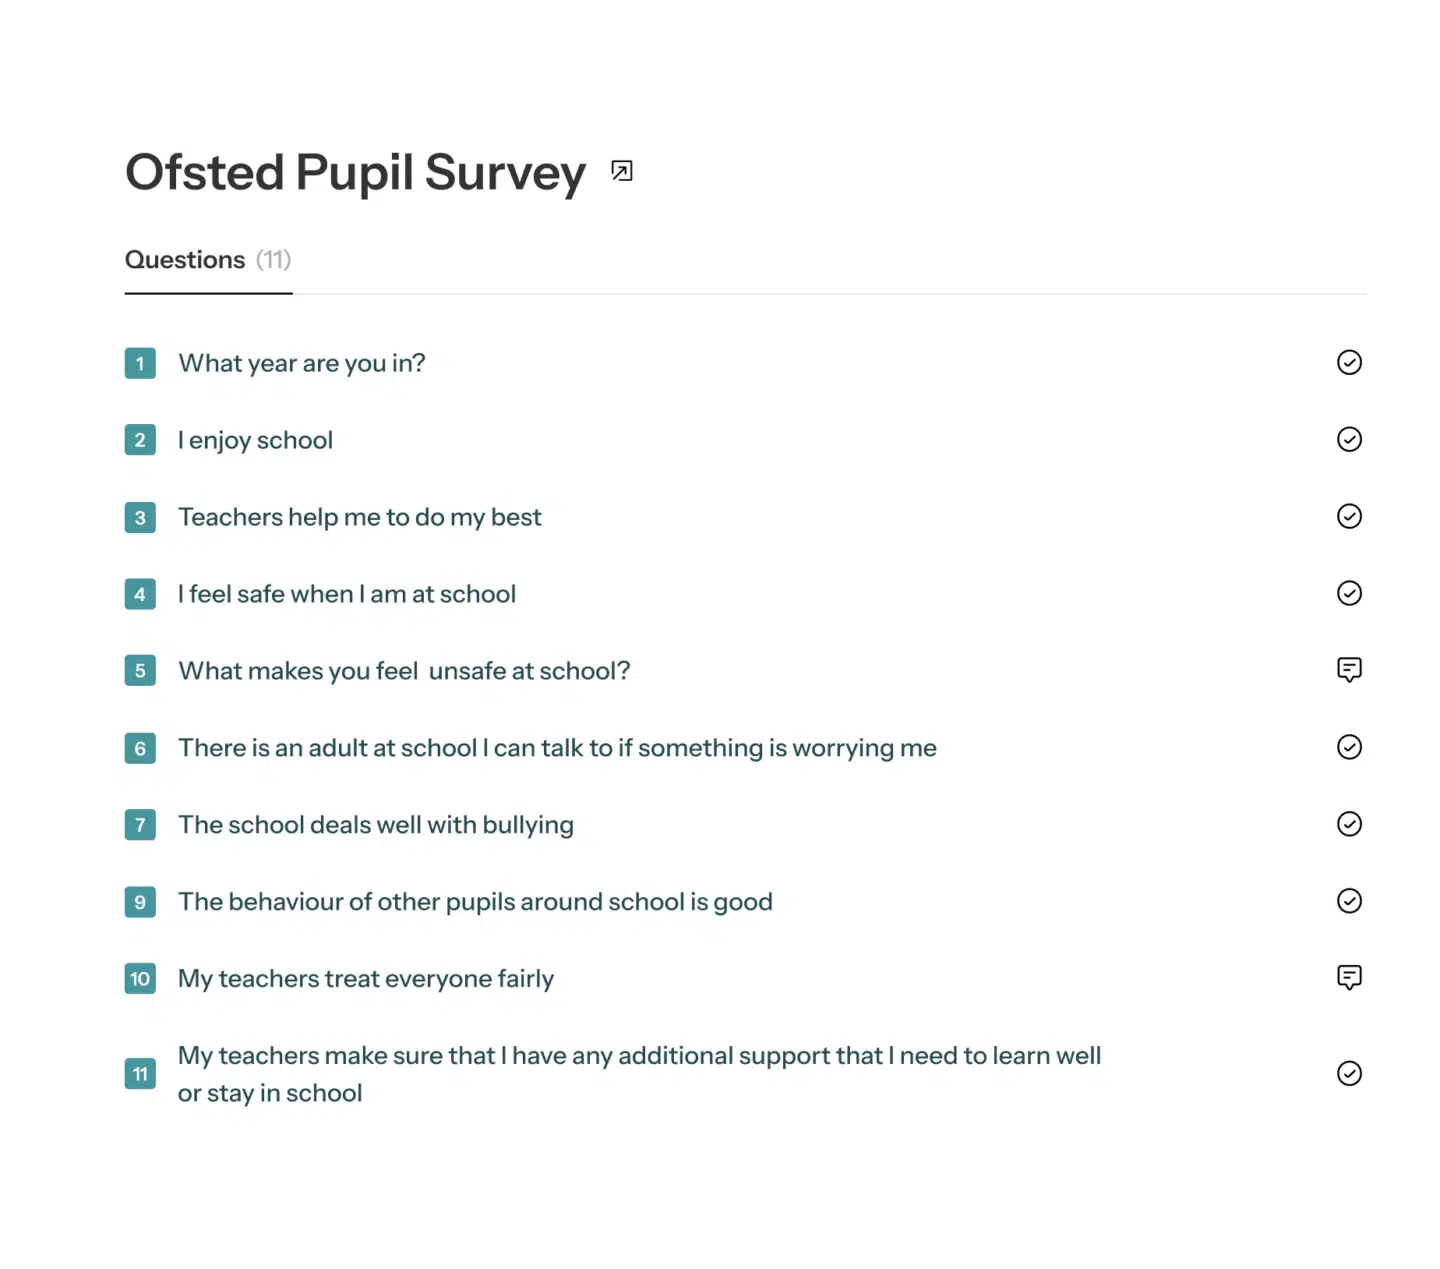
Capturing pupil voice on behaviour and enjoyment of school
Ofsted places significant weight on pupils’ lived experience. Survey data on whether pupils enjoy school and whether behaviour is generally good provides direct insight into the climate for learning.
Headline indicators such as:
- the percentage of pupils who say they enjoy coming to school
- the proportion who report that behaviour is good most of the time
can help leaders evidence the link between behaviour culture, wellbeing and attendance. Pupils who feel safe and positive about school are far more likely to attend regularly — something inspectors frequently explore.
More detailed pupil surveys, such as School Surveys’ Pupil Belonging Survey, allow leaders to probe these themes in depth without overloading the SEF itself.
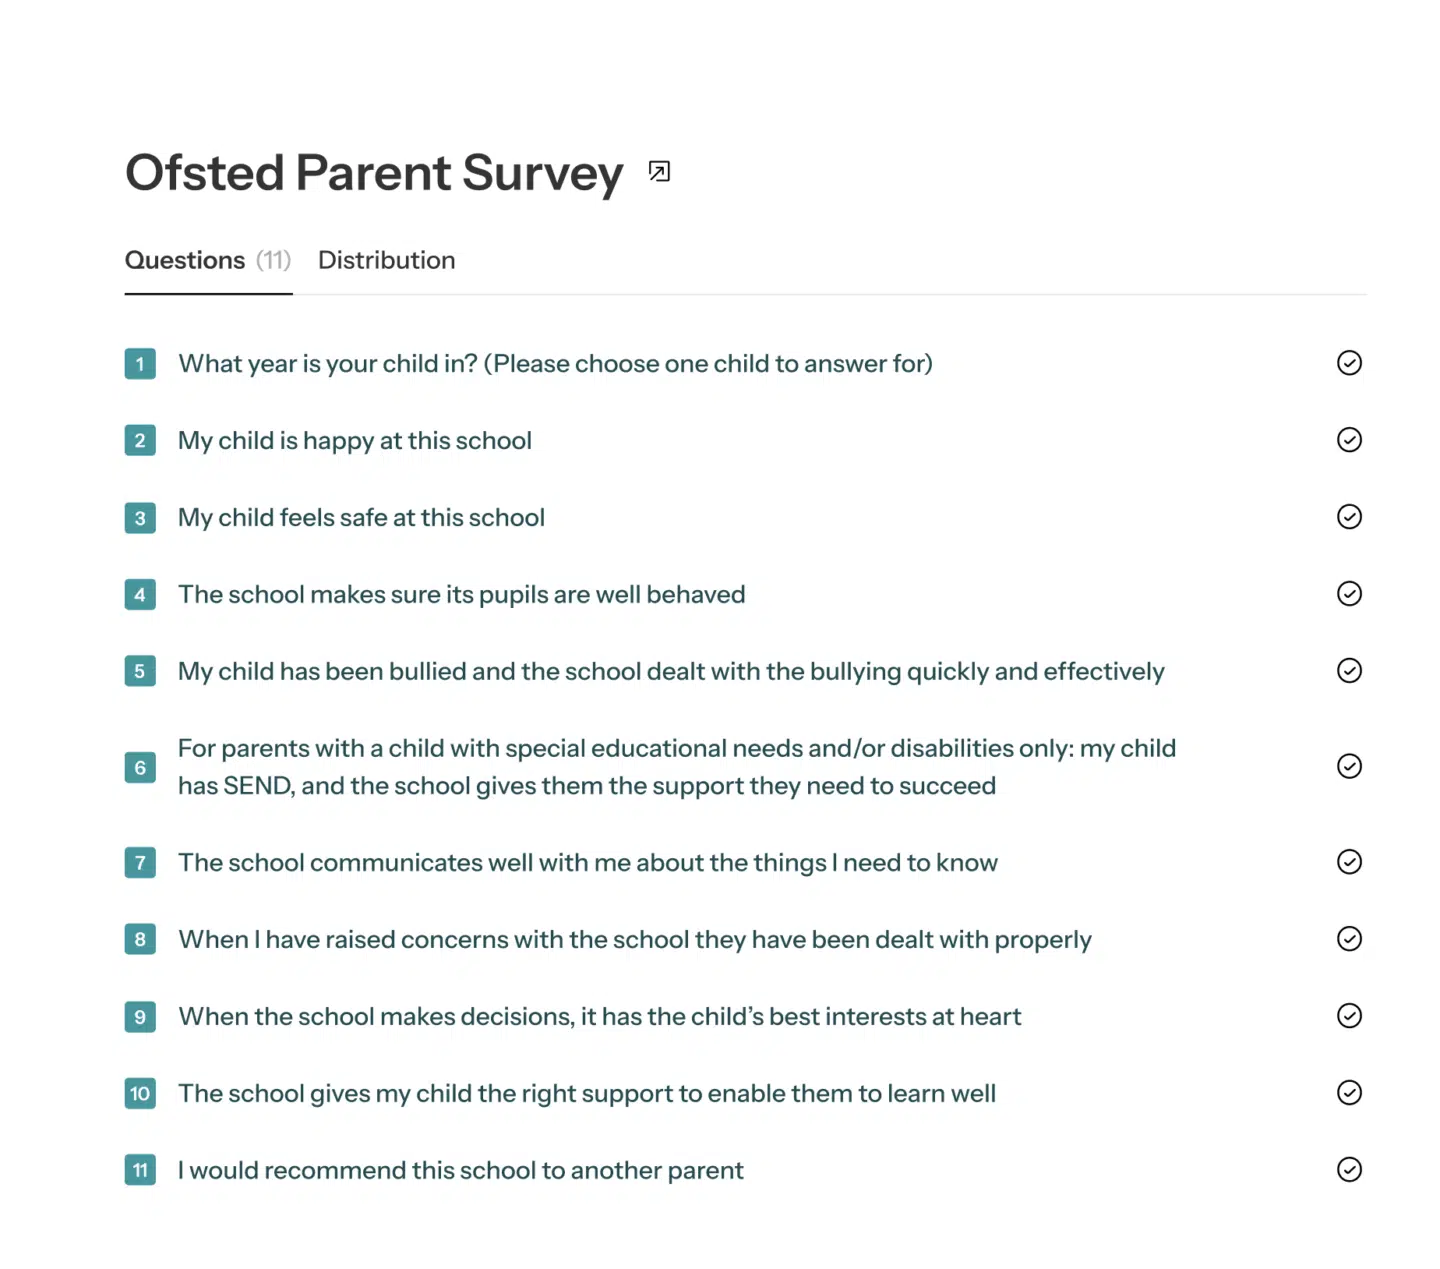
Parent perspectives on safety and communication
Parent feedback offers a valuable third lens. Ofsted will often consider whether families feel confident in the school’s approach to behaviour and safeguarding.
Survey data showing parental satisfaction — for example around communication or feeling that their child is safe — can help triangulate staff and pupil views and demonstrate a coherent whole-school approach.
Using survey data proportionately in the SEF
When evaluating attendance and behaviour, Ofsted expects leaders to draw primarily on established school data — including attendance figures, persistent absence, exclusions, suspensions and logged behaviour incidents. These remain the core evidence base for this area of the SEF.
Survey data should be used to complement, not replace, these measures. Its value lies in helping leaders interpret what the quantitative data is telling them and in evidencing how behaviour and attendance are experienced across the school community.
Referencing a small number of clear survey headlines can help leaders:
- add context to attendance and behaviour trends
- demonstrate whether policies are being applied consistently in classrooms
- show how pupils, staff and parents experience the school’s behaviour culture
- evidence leadership awareness of both strengths and pressures
Used in this way, survey data strengthens self-evaluation by adding depth and understanding to the core data that underpins judgements on attendance and behaviour.
Further ideas and support
There are lots of other posts that you may find useful here in the School Surveys blog, including boosting parent responses, support with survey planning and our summary of surveying and the new Ofsted framework.
If you are an existing member of School Surveys, remember that you can always email or phone us or book a call if you’d like any help.
If you aren’t yet a member and are interested to find out more, please book a demo here, or get in touch via hello@schoolsurveys.com.