How do we get the benchmarked data?
When you receive the reports from your surveys, you will see how your school or trust’s responses match up against ‘Schools Like Yours’.
Teacher benchmarks
The benchmarked data for teachers comes from the panel of 10,000+ teachers using TeacherTapp daily. We weight this panel’s responses to reflect national demographics in England, who are using the TeacherTapp application. We ensure these are representative by attaching sample weights to ensure our sample mirrors the phase, funding-status, age, gender, job role and regional characteristics of the teacher workforce in England. You can find out more information about how TeacherTapp ensures its data is representative by clicking here.
Almost all our questions for staff are bencharked with TeacherTapp data, as indicated by the green ‘TT’ logo. Occasionally we make other questions available that have not been put to the TeacherTapp panel (for example, some of the DfE workload consultation questions), and these will not display the TT logo.
Open questions and any that you write yourself will not show benchmarks.
Schools like you – what does this mean?
By default, we use our TeacherTapp data to benchmark against your school’s phase and free school meals quartile, or against other schools providing alternative provision. In the online results area, you are also able to change the benchmark you see by selecting any FSM quartile or the national average. We create your standard school setting from the GIAS data (checked annually), and can adjust it on request.

How does it work for trusts?
Trusts surveys allow for comparisons within a trust, as well as looking at each school’s own benchmark data. As before, we benchmark individual schools against other schools in the same phase and free school meal quartile. The trust benchmark is the average of the benchmarks of all their schools.
The horizontal black line on each bar indicates the benchmark for each school:

You will then be able to see how your school or trust compares to answers from staff in similar schools.
Splitting staff data by role
The data is usually split between teachers and support staff, to provide school leaders with clarity when reading the results, although you do not have to ask the roles question if you do not wish to. Support staff benchmarks are drawn from data collected by all schools using the School Surveys platform.
You can split the data in other ways (for example by more role options, like leaders/teachers/support staff) by changing the roles question at the start of your survey and filtering the results in the online portal. Note, adding more role options may reduce anonymity for your respondents, depending on the overall size of the group.
The PDF defaults to showing the standard teacher/support staff split, like this:

Parents, students and support staff
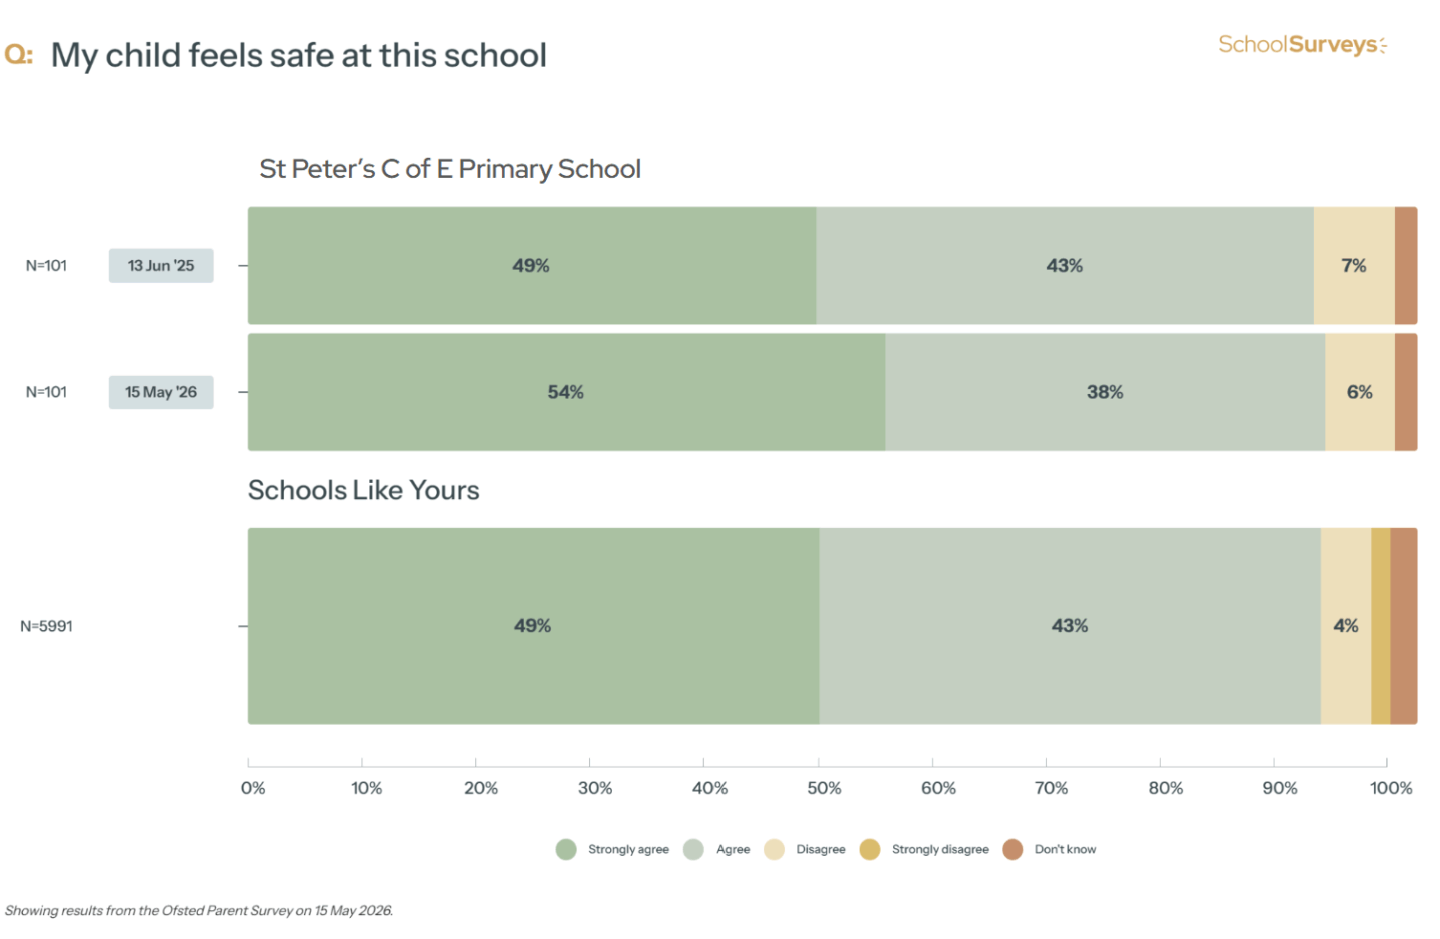
The benchmark data for parent and student surveys are obtained differently. We use results from other schools using School Surveys.
We only start to show benchmarks once we have at least 250 responses from at least 10 different institutions. Initially this will be a benchmark from all schools, and will only split to phase and FSM quartile once sufficient data has been collected.
Here is an anonymised example of a page from a parent survey with the benchmark showing:
Splitting data by year group:
With pupil and parent survey, we will also show a year group breakdown if you have used this initial question. We will show this against benchmarks for the national average for your phase (primary or secondary) if we have sufficient data and show benchmarks for the national average for each year group.

If you still need help, please get in touch at help@schoolsurveys.com or call us on 0330 043 4469 and our team will be more than happy to help.